Home
New City Planning — Project Overview
Map first, then zone explanation, analysis photo, and separate tables for each factor (population, budget, land use, etc.).
Master Plan Map
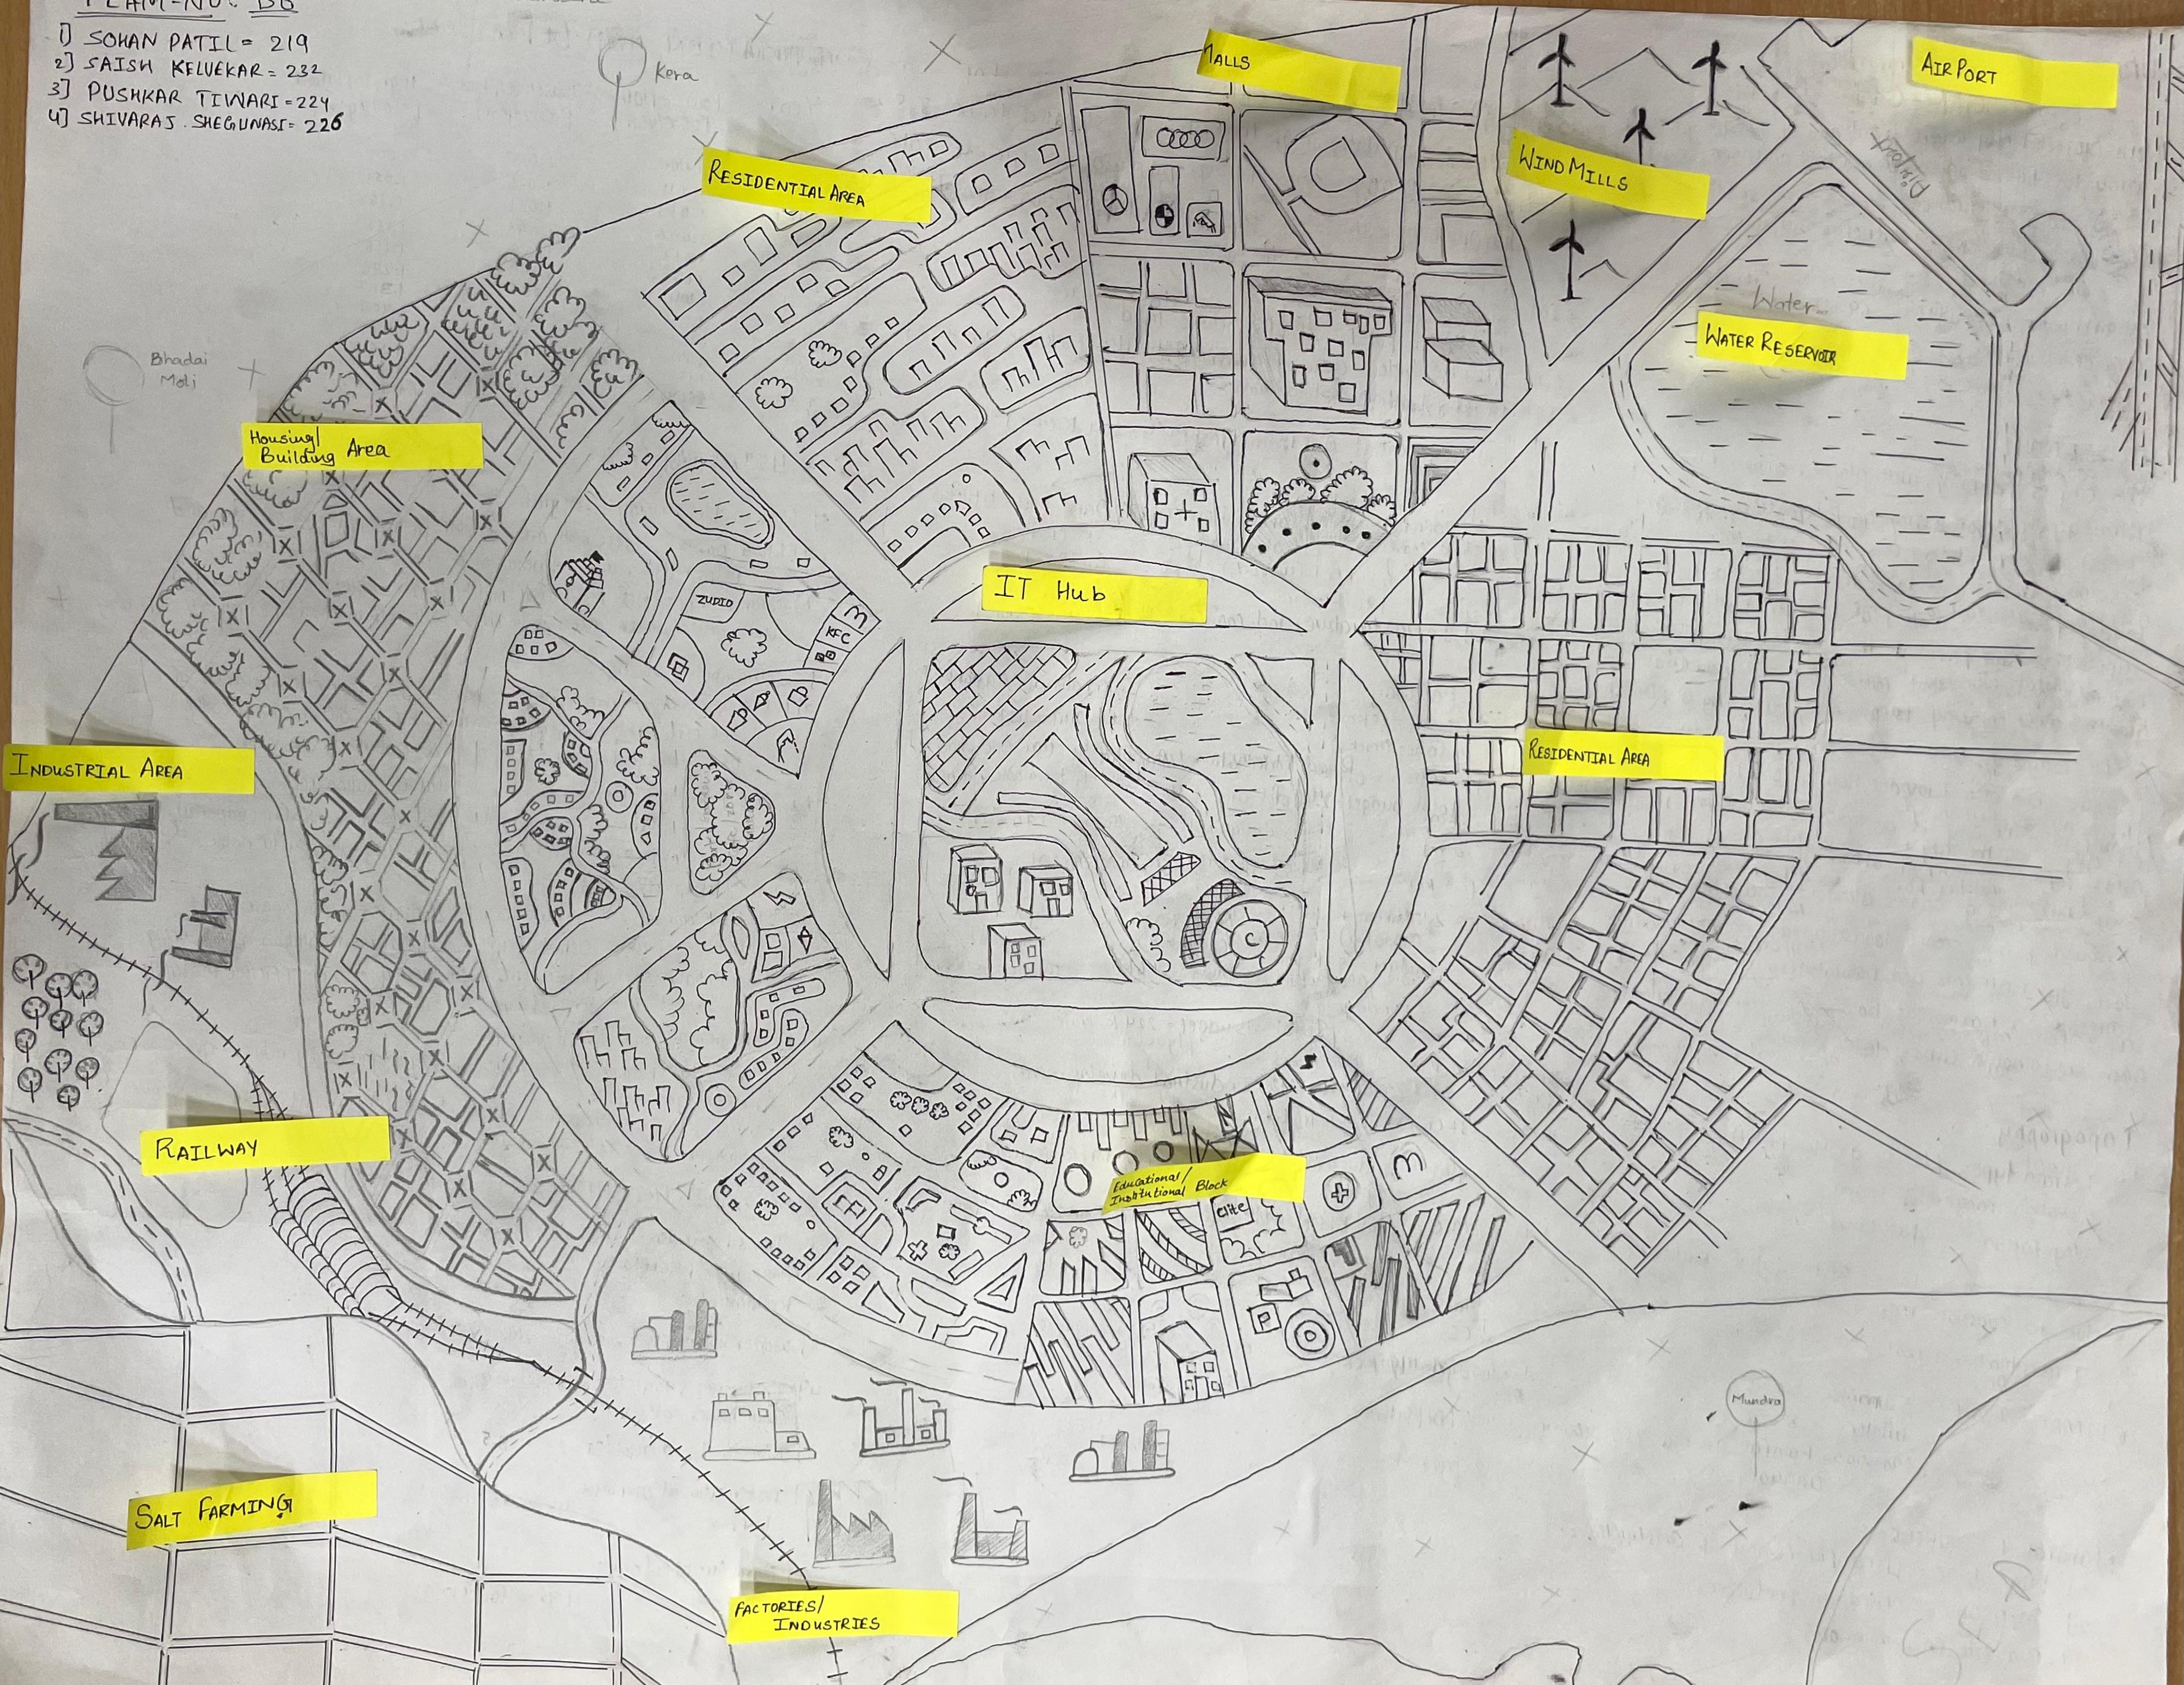
Labels: Residential Area, Industrial Area, IT Hub, Parks, Railway, Salt Farming, Airport.
Map — Zones & Descriptions
Single table showing all map zones together.
| Map Zone | Key Features |
|---|---|
| Residential Area | High-density housing blocks, local parks, schools |
| Industrial Area | Manufacturing and logistics, buffer with greenbelt |
| IT Hub | Office campus, tech parks, co-working spaces |
| Parks & Open Space | Central park, pocket parks, walking trails, lake reservoir |
| Transport Corridors | Major radial roads, ring road, rail link and station |
| Airport | Regional airport adjacent to industrial/logistics zone |
| Salt Farming | Coastal salt pans, low-intensity use, ecological buffer |
Analysis Photosheet
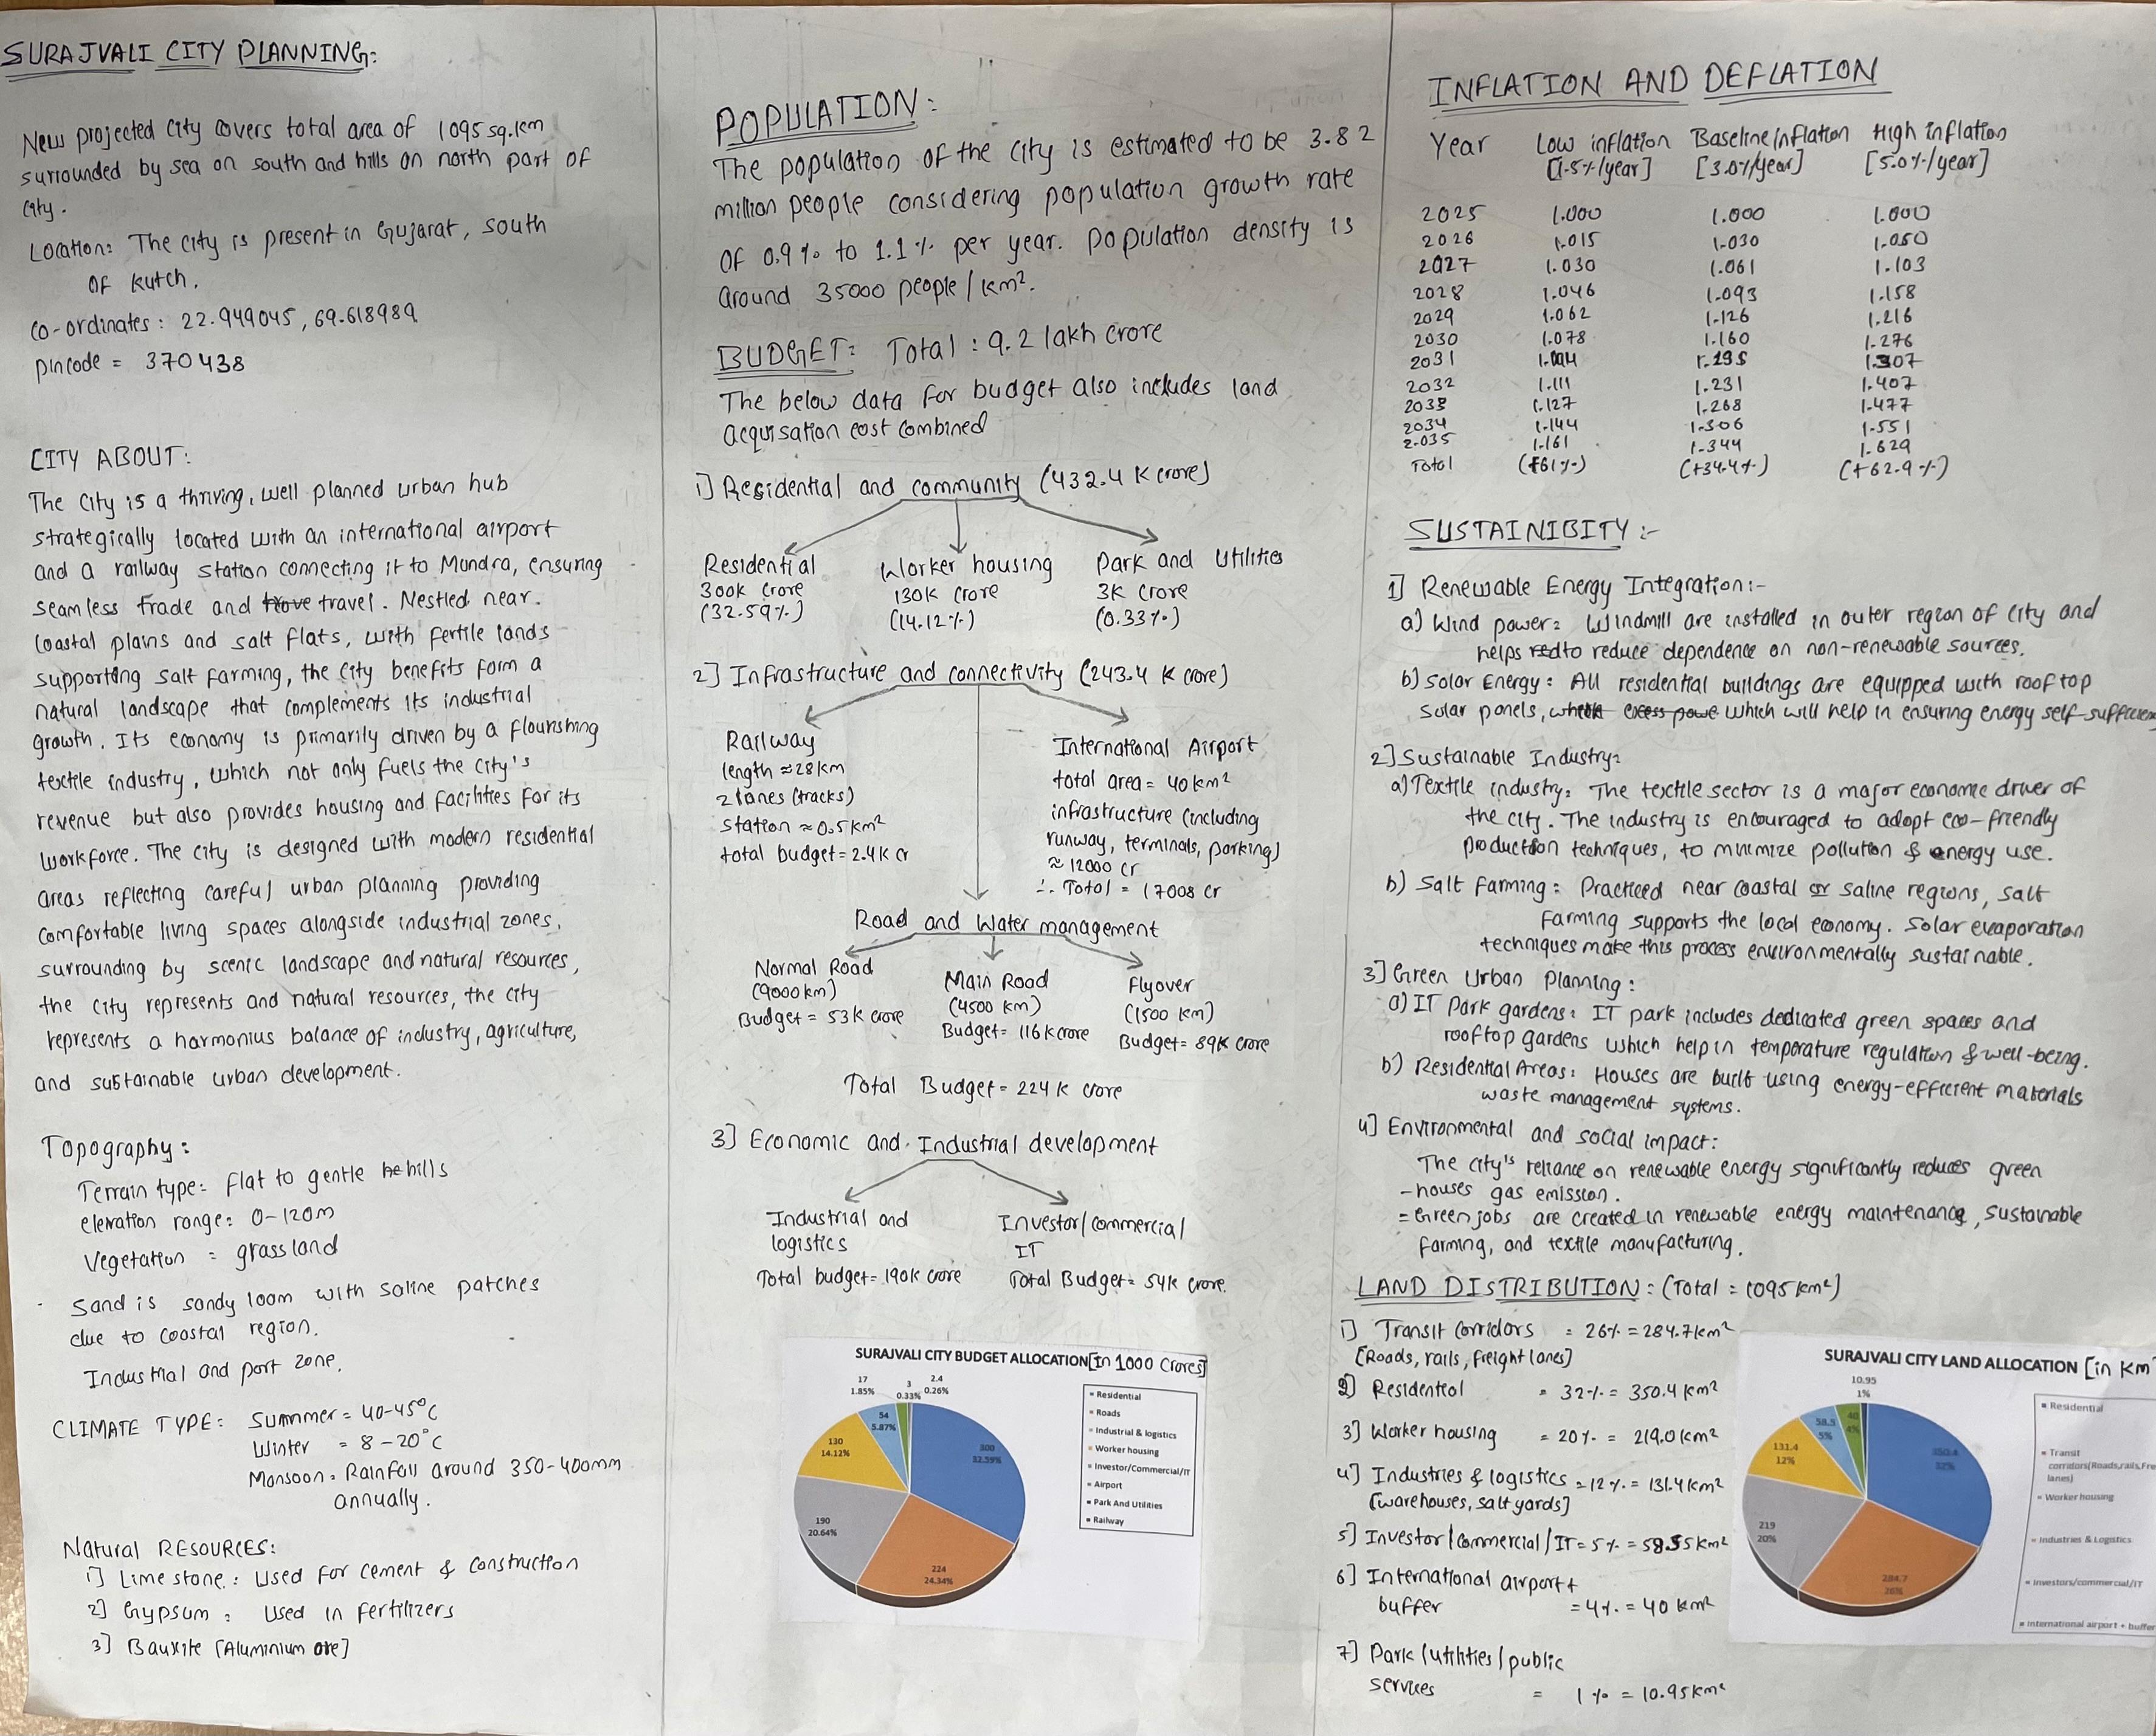
Contains handwritten data: population estimates, inflation/deflation table, sustainability notes, land use allocation pie chart, and budgets.
Analysis Data — Structured Tables
Each factor has its own card and table for clarity.
Population
| Estimated population (year) | 3.82 M |
|---|---|
| Population growth rate | 1.1% |
| Density (per sq.km) | 35,000 |
Economic / Budget
| Total budget | 9.2 L crores |
|---|---|
| Residential and Community | 432.4 K crores |
| Infrastructure and connectivity | 243.4 K crores |
| Roads and water management | 224 K crores |
| Economic and Industrial development | 244 K crores |
Inflation / Deflation
| Year | Low (1.5% / year) | Baseline (3.0% /year) | High (5.0% / year) |
|---|---|---|---|
| 2025 | 1.000 | 1.000 | 1.000 |
| 2026 | 1.015 | 1.030 | 1.050 |
| 2027 | 1.030 | 1.061 | 1.103 |
| 2028 | 1.046 | 1.093 | 1.158 |
| 2029 | 1.062 | 1.126 | 1.216 |
| 2030 | 1.078 | 1.160 | 1.276 |
| 2031 | 1.094 | 1.195 | 1.307 |
| 2032 | 1.111 | 1.231 | 1.407 |
| 2033 | 1.127 | 1.268 | 1.477 |
| 2034 | 1.144 | 1.306 | 1.551 |
| 2035 | 1.161 | 1.344 | 1.629 |
| Total | +16% | +34.4% | +62.9% |
Land Use Allocation
| Residential | ~32% |
|---|---|
| Worker housing | ~20% |
| Industries and logistics | ~12% |
| Investor/ Commercial/ IT | ~5% |
| Transit corridoes(Roads, rail...) | ~26% |
| International airport | ~4% |
| Park/ Utilities/ Public | ~1% |
Sustainability
| Renewable energy | Solar + wind integration |
|---|---|
| Water management | Rainwater harvesting, lake reservoir |
| Green corridors | Parks, urban forests, pedestrian priority |
| Waste management | Zoned collection + processing |